library(tidyverse)
library(pmtables)
library(yaml)
library(here)
library(glue)
library(magrittr)1 Introduction
Our modeling and simulation reports include a summary of the study data included in the anaylsis. Given that MetrumRGs reports are written in Latex, it can often be a time-consuming process to appropriately write and format these text-heavy data summary tables. We now make these tables, and the corresponding text summaries, in R using a YAML file to hold all the study-specific information. The yaml and pmtables packages to convert the YAML contents to a text section or table.
2 Tools used
2.1 MetrumRG packages
yspec Data specification, wrangling, and documentation for pharmacometrics.
pmtables Create summary tables commonly used in pharmacometrics and turn any R table into a highly customized tex table.
2.2 CRAN packages
dplyr A grammar of data manipulation.
yaml Methods to convert R data to YAML and back.
3 Outline
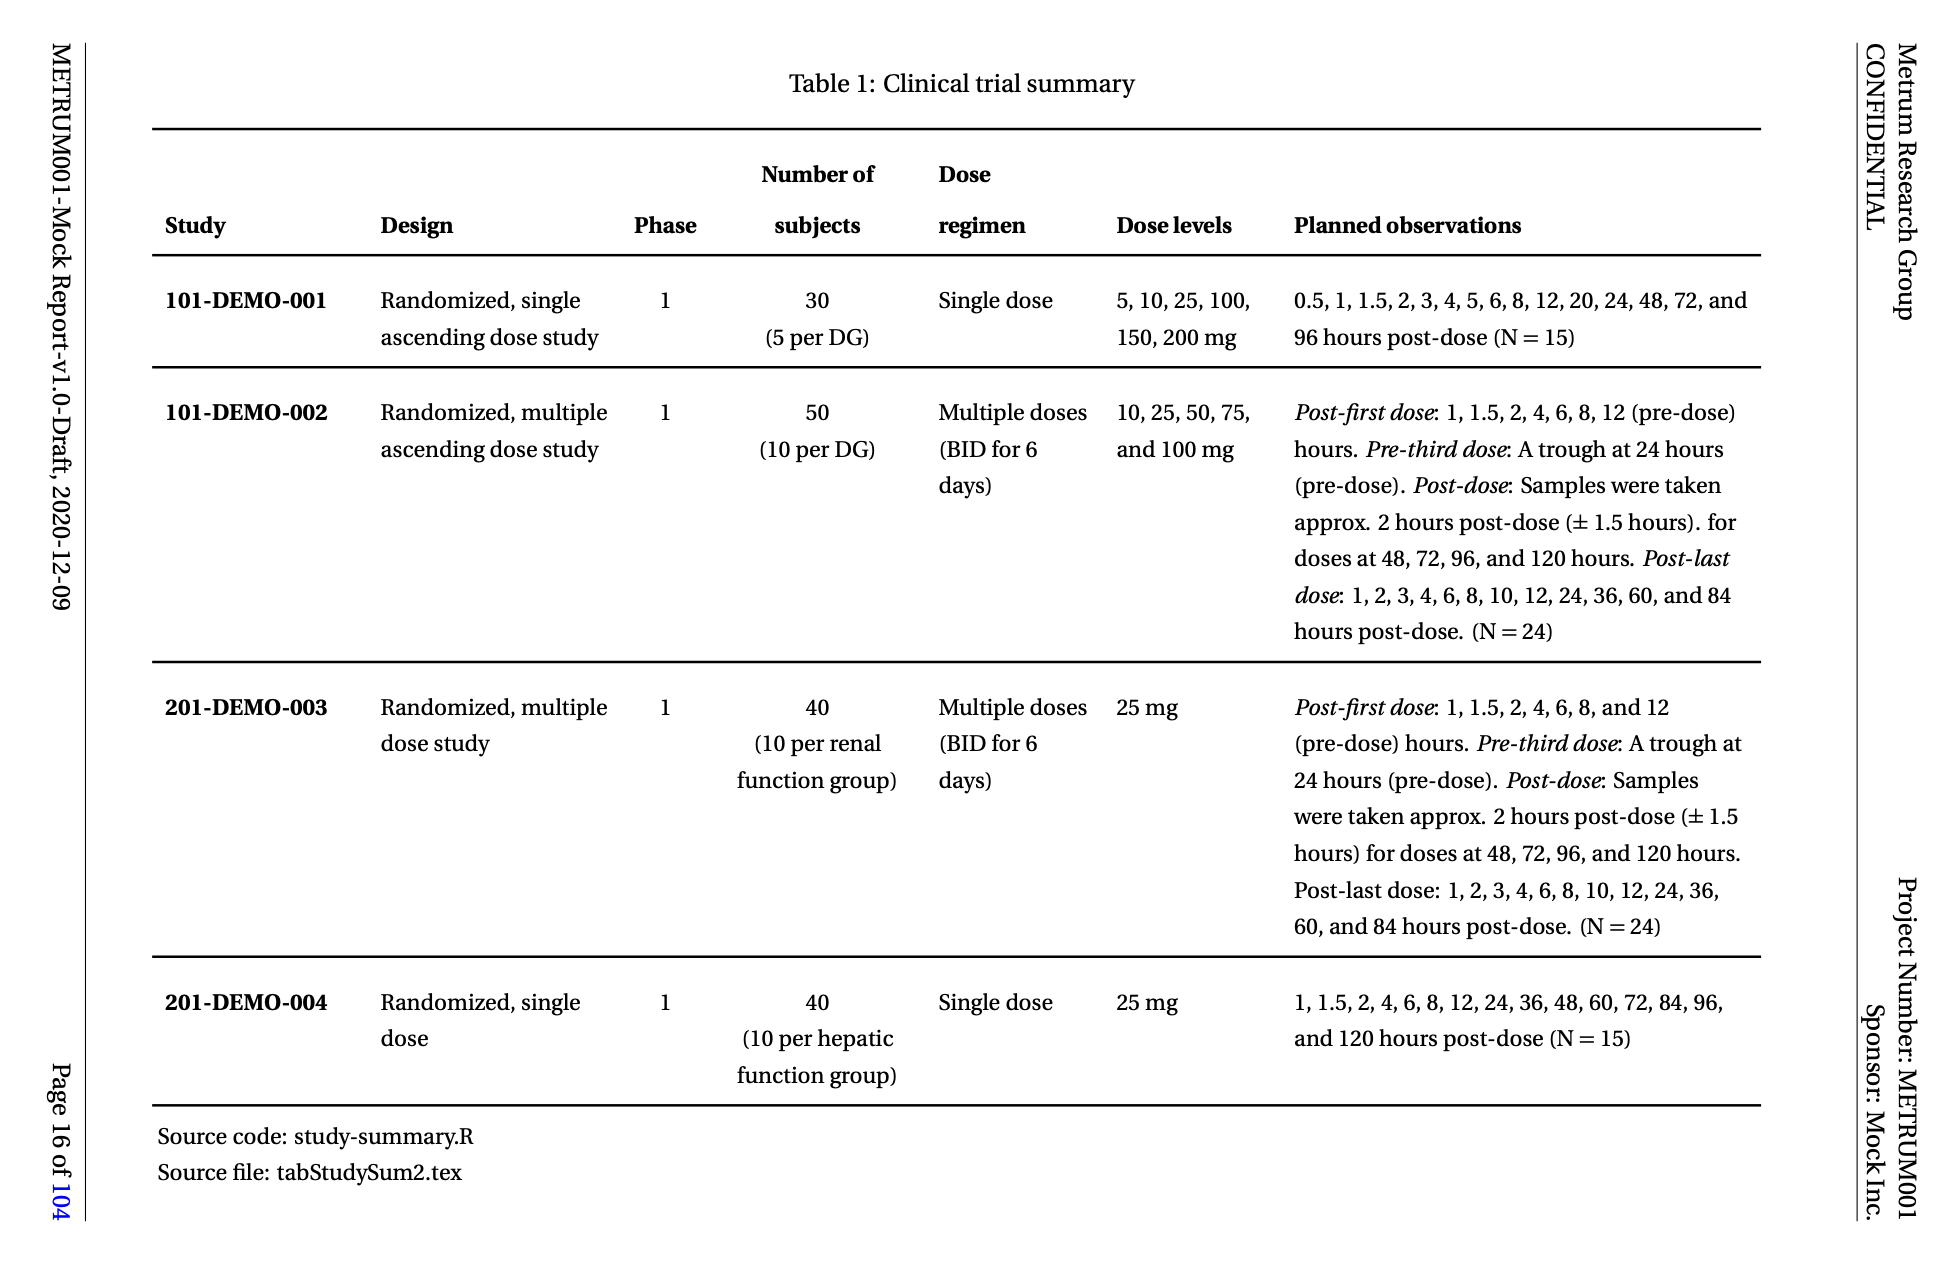
Here we walk through how to summarize the studies in your analysis in a YAML file and how to convert it to a table tex file for Latex (shown below) using R.
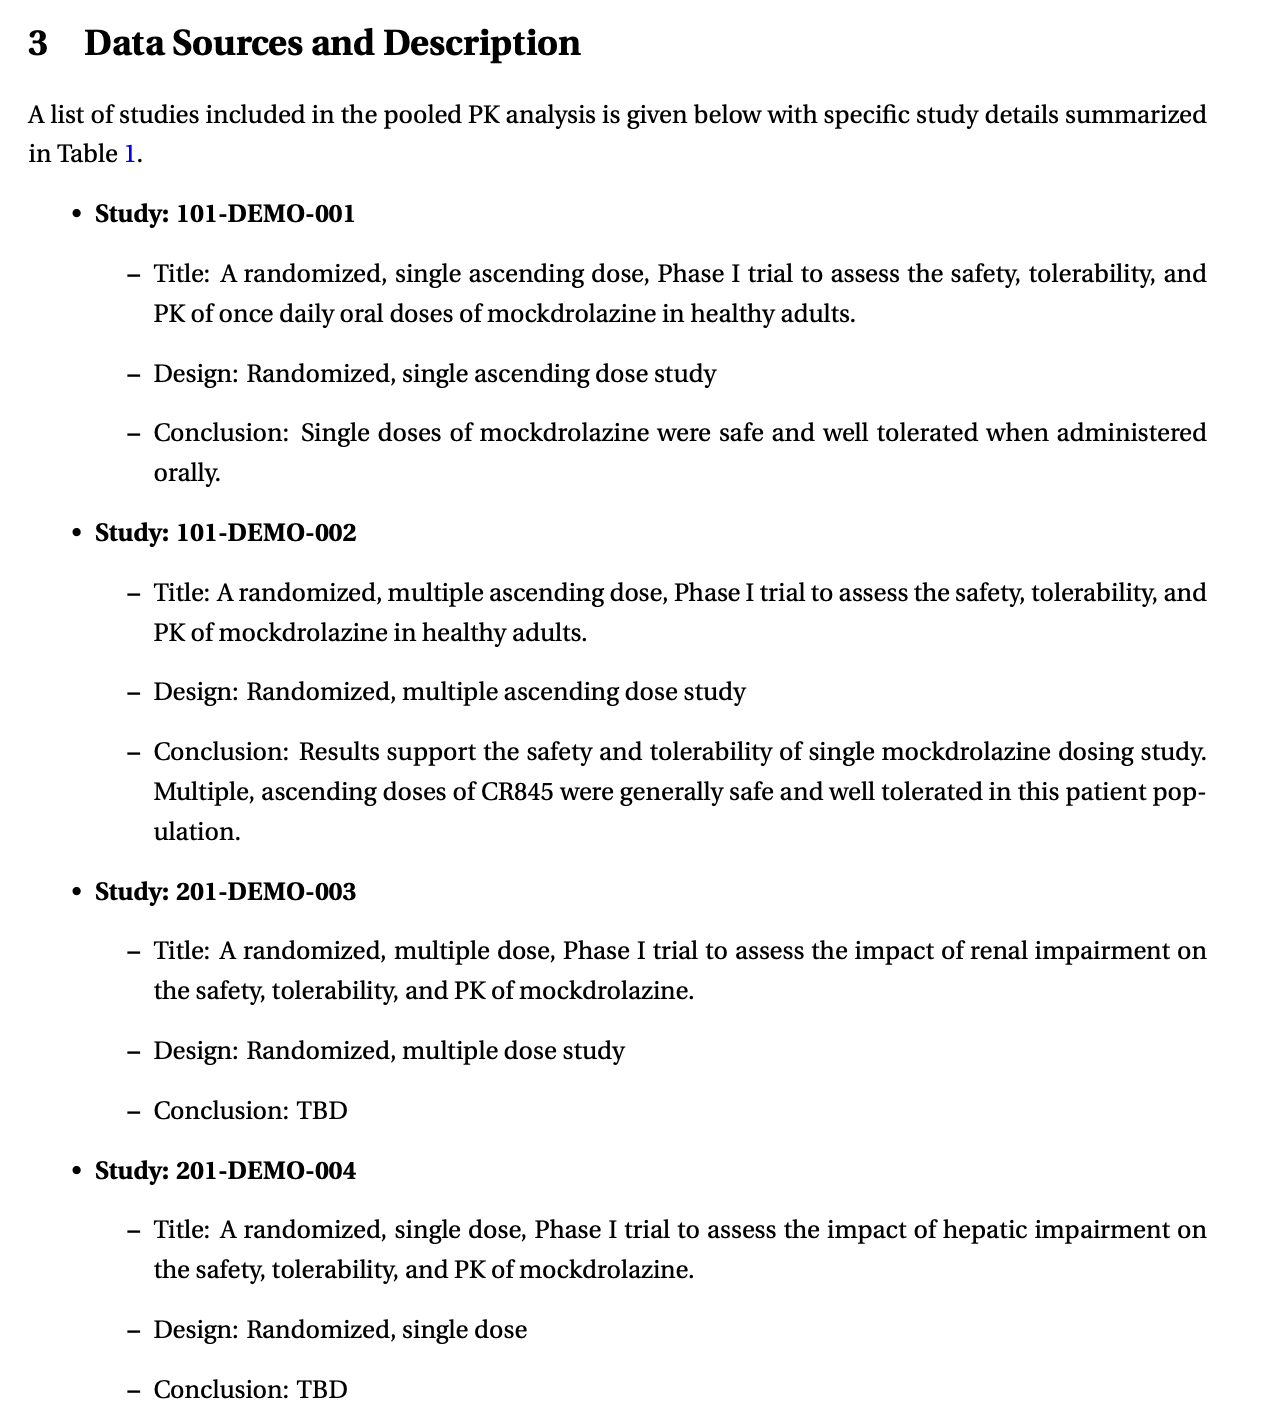
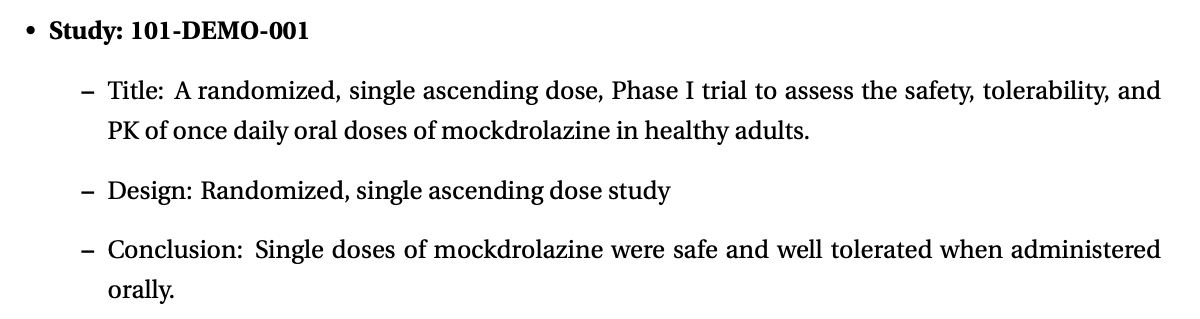
We also show how to use the information in the YAML file to create a bulletted list for each study and save it out to a tex file for Latex
4 Set up
4.1 Required packages
4.2 Other set up
5 Description of studies in the YML
First, create a YAML file that includes a description of each study. The important information extracted about each study will obviously vary from project-to-project.
Here is an example of the YAML code for one study:
A:
  Study: 101-DEMO-001
  fileEx: met01
  Title: |
    A randomized, single ascending dose, Phase I trial to assess the safety,
    tolerability, and \gls{PK} of once daily oral doses of \drugx\ in healthy adults.
  Phase: '1'
  Short: Randomized, single ascending dose study
  Patients: Healthy
  nSub: 30 \linebreak (5 per DG)
  nDose: Single dose
  D_levels: 5, 10, 25, 100, 150, 200 mg
  obTime: 0.5, 1, 1.5, 2, 3, 4, 5, 6, 8, 12, 20, 24, 48, 72, and 96 hours post-dose
  nTime: '15'
  Conc: |
    Single doses of \drugx\ were safe and well tolerated when administered orally.
  Source: |
IB, p20 (nSub + doses), p35 (times)These categories should be adapted to suit each project.
6 Study descriptions from YML to R dataframe
The description in the YAML are read into R as a dataframe using the pmtables yaml_as_df function. The resulting data frame includes one row per study and one column per category. The code below assumes you have a created a file called script/study-summary.yaml.
sdf <- yaml_as_df(here("script", "study-summary.yaml"))
head(sdf, 5)
# A tibble: 4 × 14
.row Study fileEx Title Phase Short Patients nSub nDose D_levels obTime
<chr> <chr> <chr> <chr> <chr> <chr> <chr> <chr> <chr> <chr> <chr>
1 A 101-DEMO-… met01 "A r… 1 Rand… "Health… "30 … Sing… 5, 10, … "0.5,…
2 B 101-DEMO-… met02 "A r… 1 Rand… "Health… "50 … Mult… 10, 25,… "\\em…
3 C 201-DEMO-… met03 "A r… 1 Rand… "Normal… "40 … Mult… 25 mg "\\em…
4 D 201-DEMO-… met04 "A r… 1 Rand… "Normal… "40 … Sing… 25 mg "1, 1…
# ℹ 3 more variables: nTime <chr>, Conc <chr>, Source <chr>7 Creating a study summary table
The study summary table was created by selecting the appropriate columns from the summary data frame and then using functions from the pmtables package to format it for Latex and save it out as a tex file.
df = sdf %>%
  mutate(ob_n_time = paste0(obTime, " (N = ", nTime, ")")) %>%
  select(Study, Short, Phase, nSub, nDose, D_levels, ob_n_time) %>%
  st_new() %>%
  st_rename("Design" = "Short",
            "Number of ... subjects" = "nSub",
            "Dose ...regimen" = "nDose",
            "Dose levels" = "D_levels",
            "Planned observations" = "ob_n_time") %>%
  st_align(c(Study = col_ragged(2.5),
              Short = col_ragged(3),
              Phase = 'c',
              nSub = col_fixed(2.5, center=TRUE),
              nDose = col_ragged(2),
              D_levels = col_ragged(2),
              ob_n_time = col_ragged(6))) %>%
  st_hline(from = "Study") %>%
  st_notes("Abbreviations: BID = twice daily;
              DG = Dose Group;
              Obs = Observations") %>%
  st_noteconf(type="minipage", width = 1) %>%
  st_files(output = "study-summary-table.tex") %>%
  st_sizes(font="small", row = 2, header_row = -1) %>%
  st_bold("Study", pattern = "DEMO") %>%
  stable(cols_bold = TRUE) %>%
  as_lscape() %T>%
  stable_save()
While this table fits comfortably on a single landscape page that will not always be the case. You can also create a long table version of the study summary table using the pmtable::stable_long() function.
8 Creating text descriptions of the studies
We often include text summaries of each study in our reports to accompany the study summary tables. These can also be generated from the YAML file and R data frame. The advantage here is that the full study description can be contained within a single YAML file and all text for the study summaries can be created from a single function. The code below uses a custom function called perStudy that creates a single tex file per study. The function is designed to accept a dataframe where the first column includes the file extension, the second column defines the upper level of the bullet list (in most cases the study name) and subsequent columns form the sub-bullet items. In this example, the upper bullet point is the study name and the sub-bullets include the title, study design and main conclusions from each study as shown in the screenshot below.
sdf %>%
  select(fileEx, Study, Title, Short, Conc) %>%
  rename(Design = Short,
         Conclusion = Conc) %>%
  pwalk(perStudy, out_dir = tempdir())