---
title: "Report diagnostics"
output:
  html_document:
    toc: true
    toc_float: true
    depth: 2
params:
  run: 102
  modelDir: "model/pk"
  script: "diagnostics-report.Rmd"
  yspec: "pk.yml"
  contCov: !r c("AGE","WT","ALB","EGFR")
  catCov: !r c("STUDY", "RF", "CP", "DOSE")
  etas: !r c("ETA1//ETA-KA", "ETA2//ETA-V/F", "ETA3//ETA-CL/F")
  drugNameUnits: "concentration (mg/L)"
  include_code: FALSE
  include_plots: TRUE
  run_mrggsave: TRUE
---1 Introduction
One benefit of working with R Markdown is that you can reproduce an analysis at the click of a button. Parameterized reports extend this concept one step further and allow users to specify one or more parameters to customize their analysis. This is useful when creating diagnostic plots because it lets you create your diagnostic plots once in an R Markdown template and then create those plots across multiple similar models.
We demonstrate how to generate typical diagnostic plots using pmplots and yspec on the Model Diagnostics page. Here we show you how to generate those plots from R Markdown templates and how, by changing the key inputs, you can render each template from an R script for multiple models with just a few lines of R code. (Figure 1).
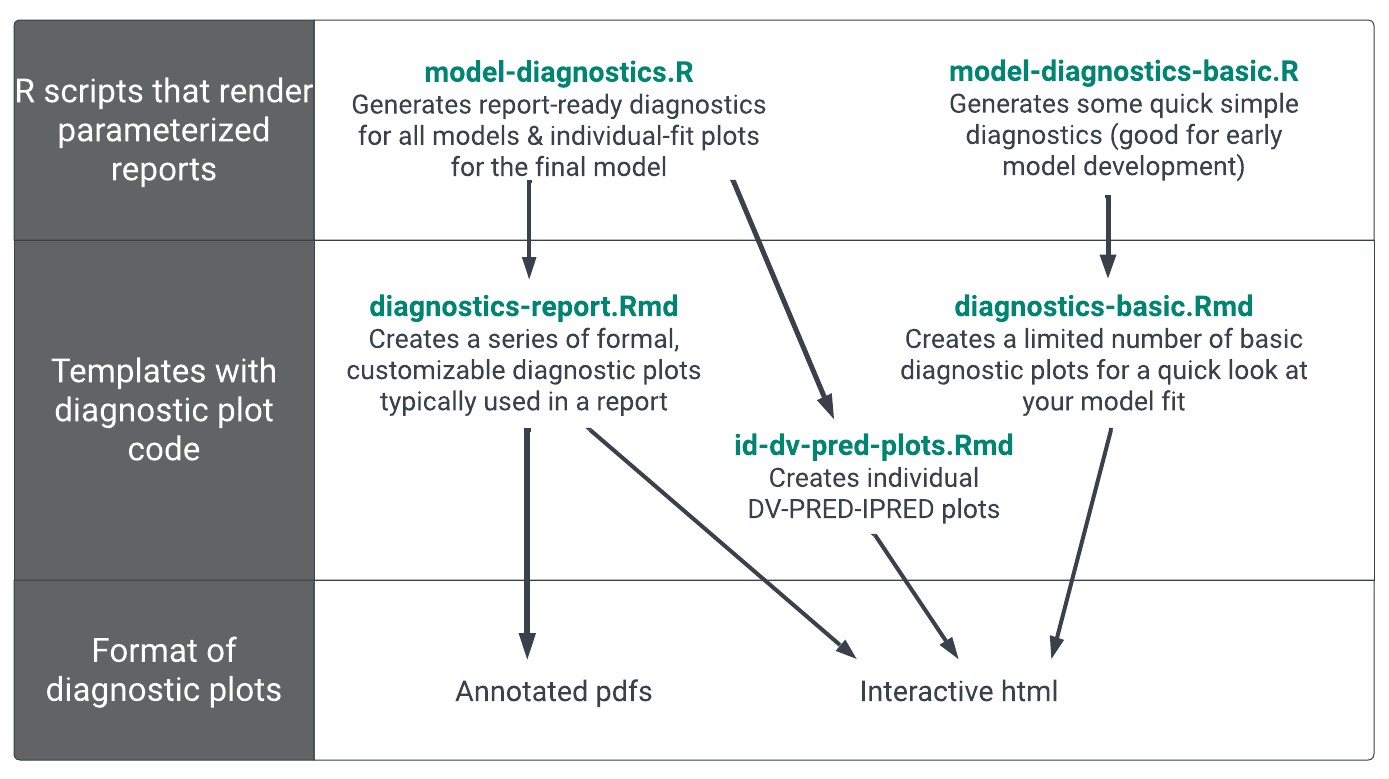
The output of these templates is flexible, here we make individual pdf and png versions of the report-ready plots for use in our Latex reports. Each template can also generate a single html summary file. We chose to render the summary file to an html (rather than a pdf) so that the rendered document includes a floating table of contents allowing easy navigation through all the summaries and diagnostics generated in the template. We include an example rendered diagnostics report to show what this output might look like.
Additional information about parameterized reports can be found on the R Markdown: The Definitive Guide website.
2 Tools used
2.1 MetrumRG packages
yspec Data specification, wrangling, and documentation for pharmacometrics.
pmplots Create exploratory and diagnostic plots for pharmacometrics.
mrggsave Label, arrange, and save annotated plots and figures.
bbr Manage, track, and report modeling activities, through simple R objects, with a user-friendly interface between R and NONMEM®.
2.2 CRAN packages
dplyr A grammar of data manipulation.
mrgmisc Format, manipulate and summarize data in the field of pharmacometrics.
3 Parameterized R Markdown templates
A parameterized report is particularly useful when you want to re-render the same Rmd code with distinct values for various key inputs. Parameters are declared once using the params field of the YAML section at the top of the Rmd document (see below) and then you can change these values for a given rendering by using the params argument in the rmarkdown::render function.
In this page, we demonstate how to construct a parameterized Rmd file, which we call diagnostics-report.Rmd. To be clear, there is no diagnostics-report.Rmd included in the accompanying repo. This page is intended to guide you through creating your own parameterized Rmd file.
3.1 YAML header
The YAML section at the top of the diagnostics-report.Rmd looks like this:
You first define the title and type of output (as you would for a typical R Markdown file): we chose an html file with a floating table of contents. Parameters are then specified using the params field.
3.2 The params field
The parameters defined in the params params field available for use in the R Markdown environment and the R console in RStudio. The params are essentially a list and can be accessed using params$run or params$modelDir. In this example we use params to define some model specific features and to control the behaviour of knitr.
3.2.1 Model-specific parameters:
- run: model run number.
- modelDir: model directory.
- script: name of the script that creates the figures/tables (for mrggsave annotation).
- yspec: name of your define spec file, e.g., pk.yml.
- contCov: names of continuous covariates of interest (as they appear in your spec). Note that this parameter value is prefaced with !r to indicate that the value is an R expression rather than a literal value, e.g.,
!r c("AGE", "WT", "ALB", "EGFR"). - catCov: names of continuous covariates of interest (as they appear in the spec and prefaced with !r).
- etas: vector of the ETAs to be used by pmplots. If “ETA1”, “ETA2” etc. are used then this is how they appear on the plots. If NONMEMName//DisplayName is used then the plots use the display name, e.g.,
!r c("ETA1//ETA-KA", "ETA2//ETA-V/F", "ETA3//ETA-CL/F"). - drugNameUnits: the drug label that should appear in plots.
3.2.2 Behaviour specific parameters:
- include_code: define whether code should appear in the knitted html using true/false.
- include_plots: define whether plots should appear in the knitted html using true/false.
- run_mrggsave: define whether pdf versions of the plots should be saved out with mrggsave when rendering, using true/false.
3.2.3 Template specifics
When knitting your R Markdown template (see below), you can choose to either use the default values defined in the params section of the R Markdown, or you can update any params directly in the rmarkdown::render function call. Obviously, you can (and should) change the list of params included in the YAML section to suit your project. We walked through the code that you might include in the diagnostics-report.Rmd template, showing how to we create typical diagnostic plots using pmplots and yspec, on the Model Diagnostics page.
While this section focuses on the template we use to generate report-ready figures (in diagnostics-report.Rmd), you can create other templates with a similar set-up. They would all include a YAML header with a params section and the code to make, and save out, plots. For example, a id-dv-pred-plots.Rmd template could create individual DV-PRED-IPRED plots, and it save these plots as pdfs but does not automatically display them in the html file to reduce the knitting time (this can easily be changed). A diagnostics-basic.Rmd could create a limited number of basic diagnostic plots and displays them in an html file for a quick look at your model fit. Given it is only meant to provide a quick look at your model fit, this template would likely not save any plots to pdf/png format.
4 Using R to knit the parameterized templates
Now you have your diagnostic templates setup, you can use the rmarkdown::render function to knit them. We use the model-diagnostics.R script to:
- Create report-ready diagnostic plots described in
diagnostics-report.Rmdfor all six models. - Walk through the different ways you can render these templates with a few lines of code.
- Showcase our helper function that will render a template for a given model and, if piped to “browseURL”, will pop open the html of model diagnostics in a new browser window.
4.1 Required packages
library(tidyverse)
library(here)
library(rmarkdown)
4.2 Other set up
Define your model directory and the template you want to use. (To run this code, you will need to create this Rmd template.)
modelDir <- here("model", "pk")
rmd_template <- here("script", "diagnostic-templates", "diagnostics-report.Rmd")
4.3 Creating diagnostics
4.3.1 Customizing your params before knitting your template
This first example includes shows several params defined in the template that you might want to customize remotely but typically you’d only do this if you need to the change the default params you defined in your template (see later examples below).
modelSpecifics <- list(
  yspec = "pk.yml",
  contCov = c("AGE","WT","ALB","EGFR"),
  catCov = c("STUDY", "RF", "CP", "DOSE"),
  etas = c("ETA1//ETA-KA", "ETA2//ETA-V/F", "ETA3//ETA-CL/F"),
  include_code = TRUE,
  include_plots = TRUE,
  run_mrggsave = TRUE)
You can then knit the R Markdown template using the rmarkdown::render function
rmarkdown::render(
  here("script", "diagnostic-templates", "diagnostics-report.Rmd"),
  params = modelSpecifics,
  output_dir = here(modelDir, "100"),
  output_file = "diagnostic-report-100.html",
  envir = new.env() # good practice to render in new environment for reliability
)
Alternatively, you could use our model_diagnostics() helper function.
The model_diagnostics() helper function knits the R Markdown template to an HTML file located in your model output directory and creates pdf/png versions of each figure in deliv directory. You can either pass this function a bbr model object, which is particularly useful if you’re doing this somewhere like a model management or submission script, or you can pass the function a path to your model directory.
mod <- bbr::read_model(file.path(modelDir, 100))

mod %>%
  model_diagnostics(
    modelSpecifics,
    template = rmd_template
  )
4.3.2 Different options for defining parameters or knitting the template
The params defined in the YAML header of your template will be used by default and so you often only need to update the parameters that you need to change between models.
modelSpecifics <- list(
  contCov = c("AGE", "WT","ALB","EGFR"),
  catCov = c("STUDY", "RF", "CP", "DOSE"),
  etas = c("ETA1//ETA-KA", "ETA2//ETA-V/F", "ETA3//ETA-CL/F")
)
You can pass a path to a model output directory (instead of a bbr object) to the model_diagnostics function. You can automatically pop open the compiled html in a new web browser window by piping the output of model_diagnostics to browseURL. This is possible because the model_diagnostics function invisibly returns the path to the html file.
model_diagnostics(
  file.path(modelDir, 102),
  modelSpecifics,
  template = rmd_template
) %>%
  browseURL()
You can also choose to define your params directly inside the model_diagnostics function
model_diagnostics(
  .mod = file.path(modelDir, 103),
  .p = list(
    contCov = c("AGE", "WT", "ALB", "EGFR"),
    catCov = c("STUDY", "RF", "CP", "DOSE"),
    etas = c("ETA1//ETA-KA", "ETA2//ETA-V/F", "ETA3//ETA-CL/F")
  ),
  template = rmd_template
) %>%
  browseURL()
If nothing has changed compared to the previous modelSpecifics list, you can simply pass through the previously defined list.
model_diagnostics(
  file.path(modelDir, 105),
  modelSpecifics,
  template = rmd_template
) %>%
  browseURL()