Introduction
The following code examples in this Expo are available in a GitHub repository.
This page describes how to download and/or clone the repository (repo), the directory structure, and some of the tools to set up and manage the R packages used in the analysis.
Note, the code provided in this GitHub repo may not work exactly as written on your system. The code was written and tested in a Metworx environment; minor modifications may be required to allow for differences in the setup of your modeling environment. If you believe an error was included in any of the scripts, or would like help in troubleshooting the code, you can post an issue to the GitHub repo by following the Report an issue link on the right sidebar of this page.
Tools used
MetrumRG packages
Metrum Package Network (MPN) / pkgr Create and manage curated, reproducible R package environments.
CRAN packages
renv Reproducible environments for your R projects.
Browsing and downloading the code
All the code and data for this Expo are located in the GitHub repository. The GitHub web interface allows you to explore the code and data in the project from your web browser.
The entire Expo can be downloaded by clicking the green Code dropdown and selecting Download ZIP.
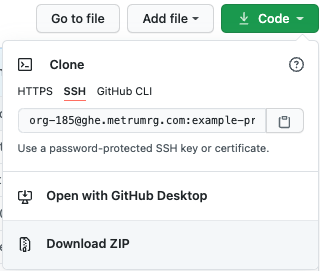
Users familiar with Git and GitHub can clone the repo and interact with it as they would in any other Git project.
Repository structure
This Expo uses the same directory and file structure as all Metrum Research Group (MetrumRG) projects. The repo README briefly outlines the location of key datasets and scripts. Below are descriptions of some of the top-level directories and files in the repo.
data/- Data files with the following subdirectories:data/source/- Raw source data. This directory is empty because this Expo doesn’t demonstrate the assembly of a derived data set from the source data.data/derived/- Data sets derived for use in this Expo.
- Data specification YAML files. See Introduction to yspec for more details.
script/- Analysis scripts. All scripts (.Rand.Rmdfiles) are described in Project walkthrough page listing .model/- NONMEM® control files and model outputs. Typically, there will be subdirectories for different parts of the analysis.deliv/- Project deliverables with the following subdirectories:deliv/figure/- Figures, typically pdf and png files. There will be subdirectories for different parts of the analysis.deliv/table/- Tables, typically as.texor.pdf, contain subdirectories paralleling those indeliv/figure.deliv/report/- LaTeX files for creating the final report. MetrumRG uses LaTeX for report writing, though this part of our process was not detailed in this Expo.
Setting up your R environment
MetrumRG manages R packages and their dependencies on a project-by-project level as each project uses its own isolated package library. This accomplishes two objectives:
- All the packages needed for a project are installed with the package versions you expected.
- The R environment can be easily reproduced later, either by you or a collaborator, to reliably reproduce your analysis.
We do this using three tools: pkgr, MPN, and renv. To learn more about how and why this works well, you can find more information in the Metworx Knowledge Base here.
Although we recommend this approach to manage your R environment, the code in this Expo will run without setting up your R environment in this way.
Install R packages with pkgr
Install all R packages needed to run this analysis using pkgr. If you’re using Metworx, you’ll already have pkgr installed. If you’re not using Metworx, click here for installation instructions.
Note that pkgr and renv are already set up in this repo so you can get started by running the pkgr install command. To read more about how to use this approach in your own projects, click here.
In your terminal (not your R console) navigate to the top-level of this project repository and run the following:
pkgr installThis reads the pkgr.yml file and begins installing the requested packages. (To learn more about the pkgr.yml configuration file, click here.) When pkgr finishes its installation, restart your R session and begin working.
There are numerous packages used in this Expo and installing them will take some time. If you are using Metworx, we recommend launching a workflow with at least eight vCPUs on the head node for improved efficiency as pkgr uses all available cores to install packages.