Data description and definitions for the exdata3.csv model data set.
yspec
data
Data description
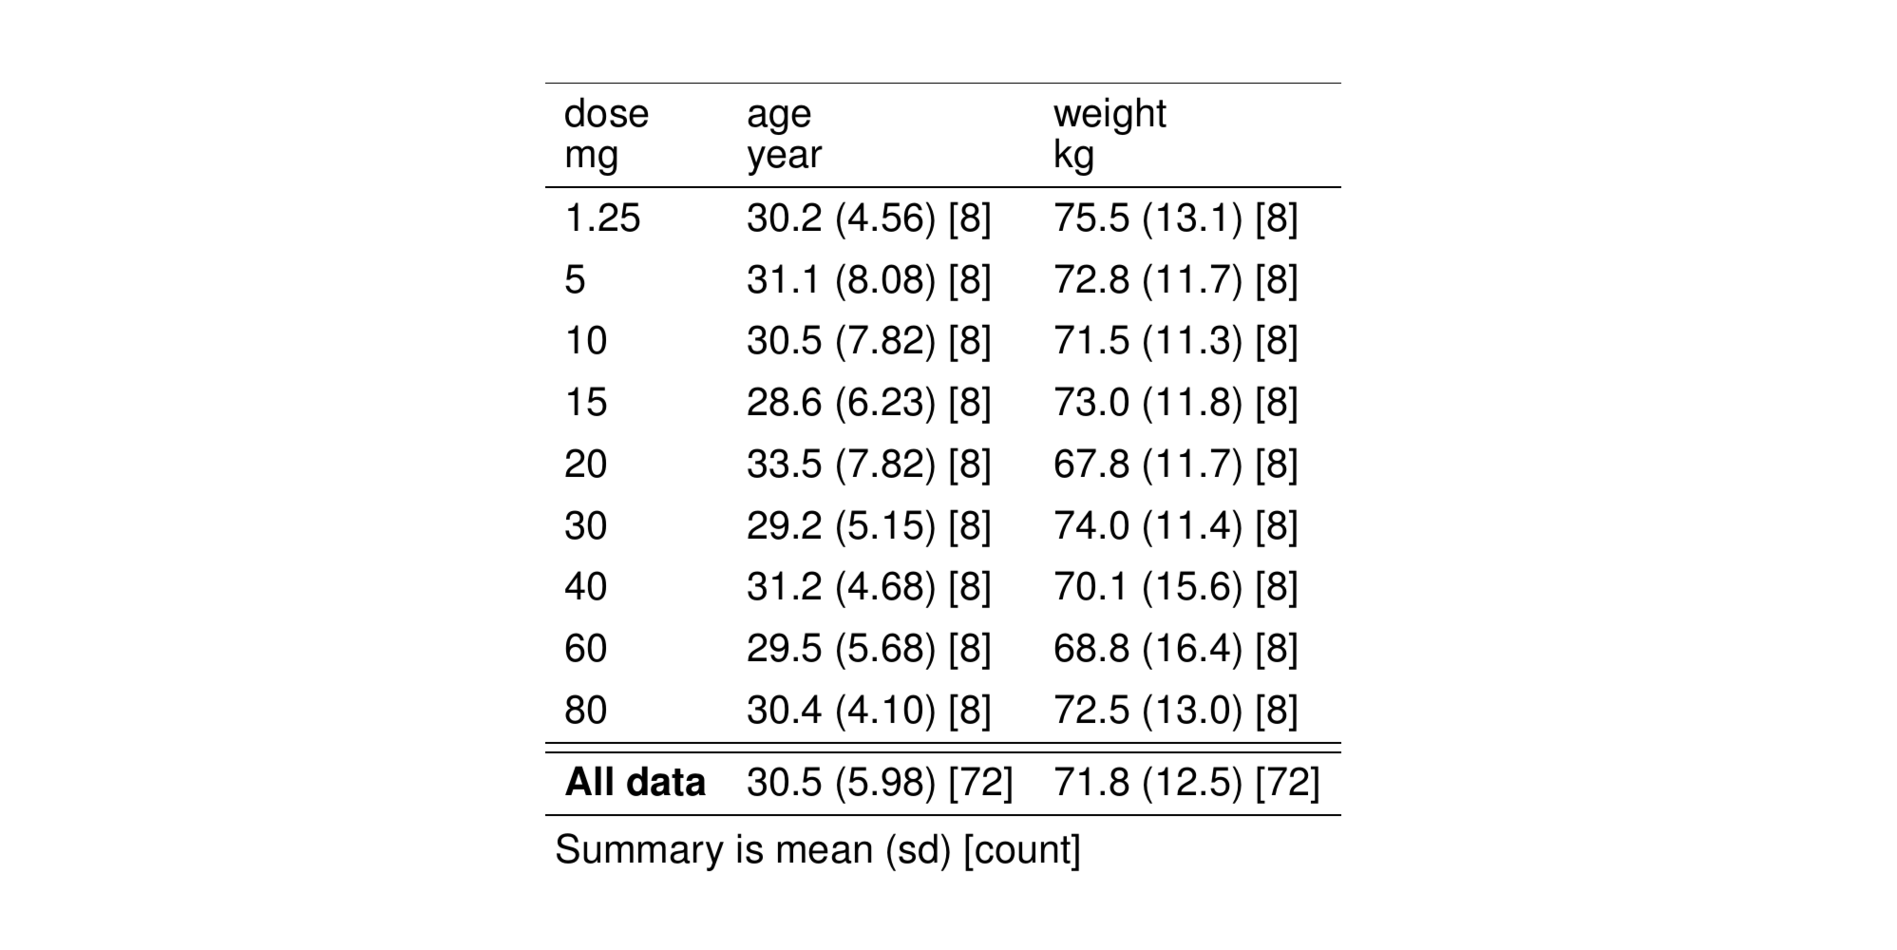
This data comes from a hypothetical study where the inhibition of factor Xa (FXa) following a single dose was studied in 72 patients consisting of 34 male and 38 female participants. For each subject, drug concentration and FXa inhibition were measured pre-dose and at 15 time points ranging from 5 minutes to 24 hours post-dose where doses ranged from 1.25 mg to 80 mg.
Shown here, the pmtables package generates data summary tables for age and weight stratified by dose level.
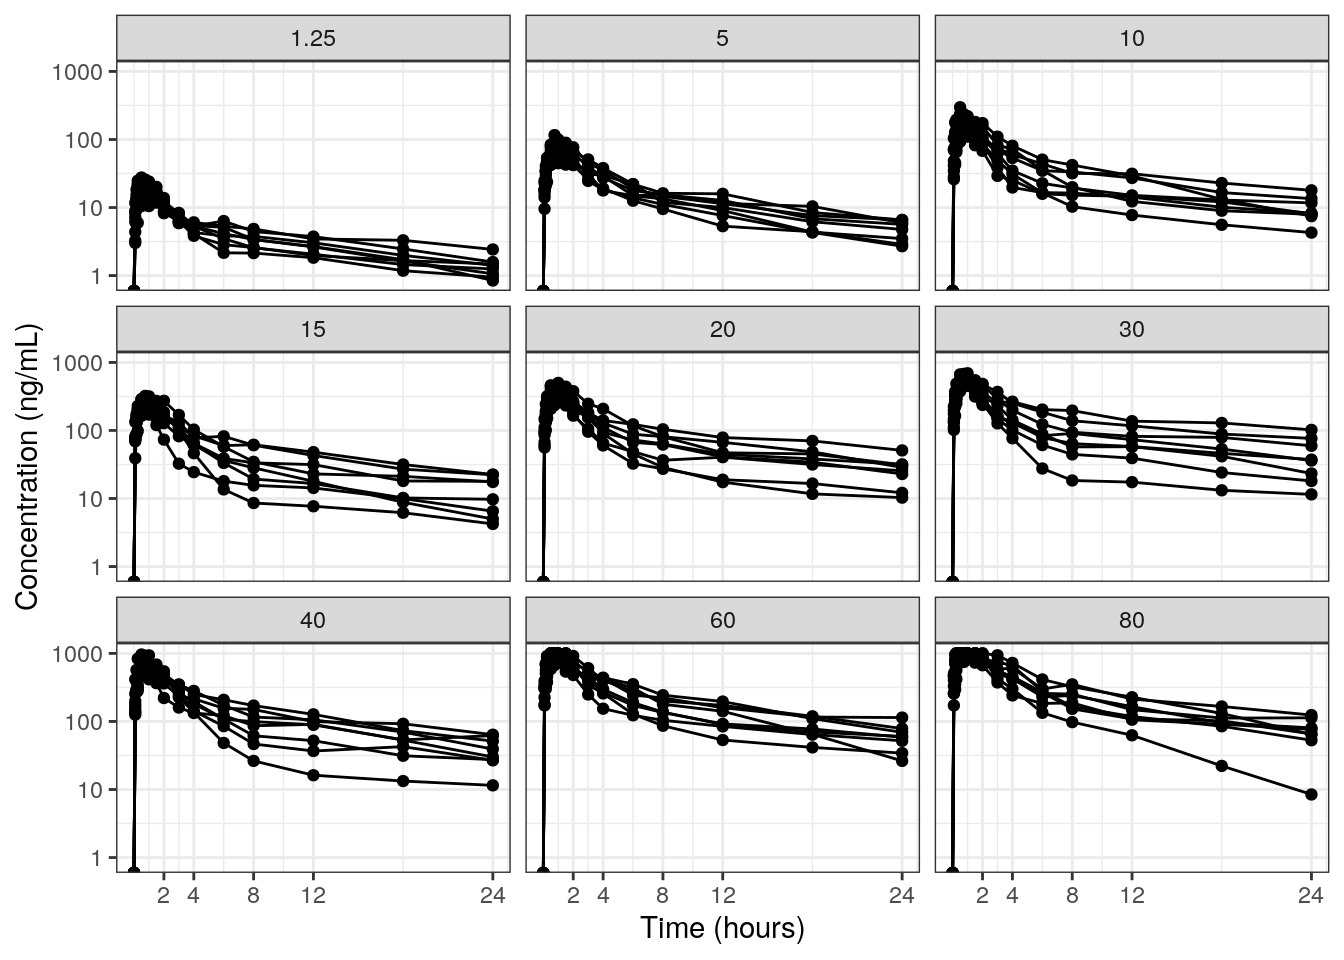
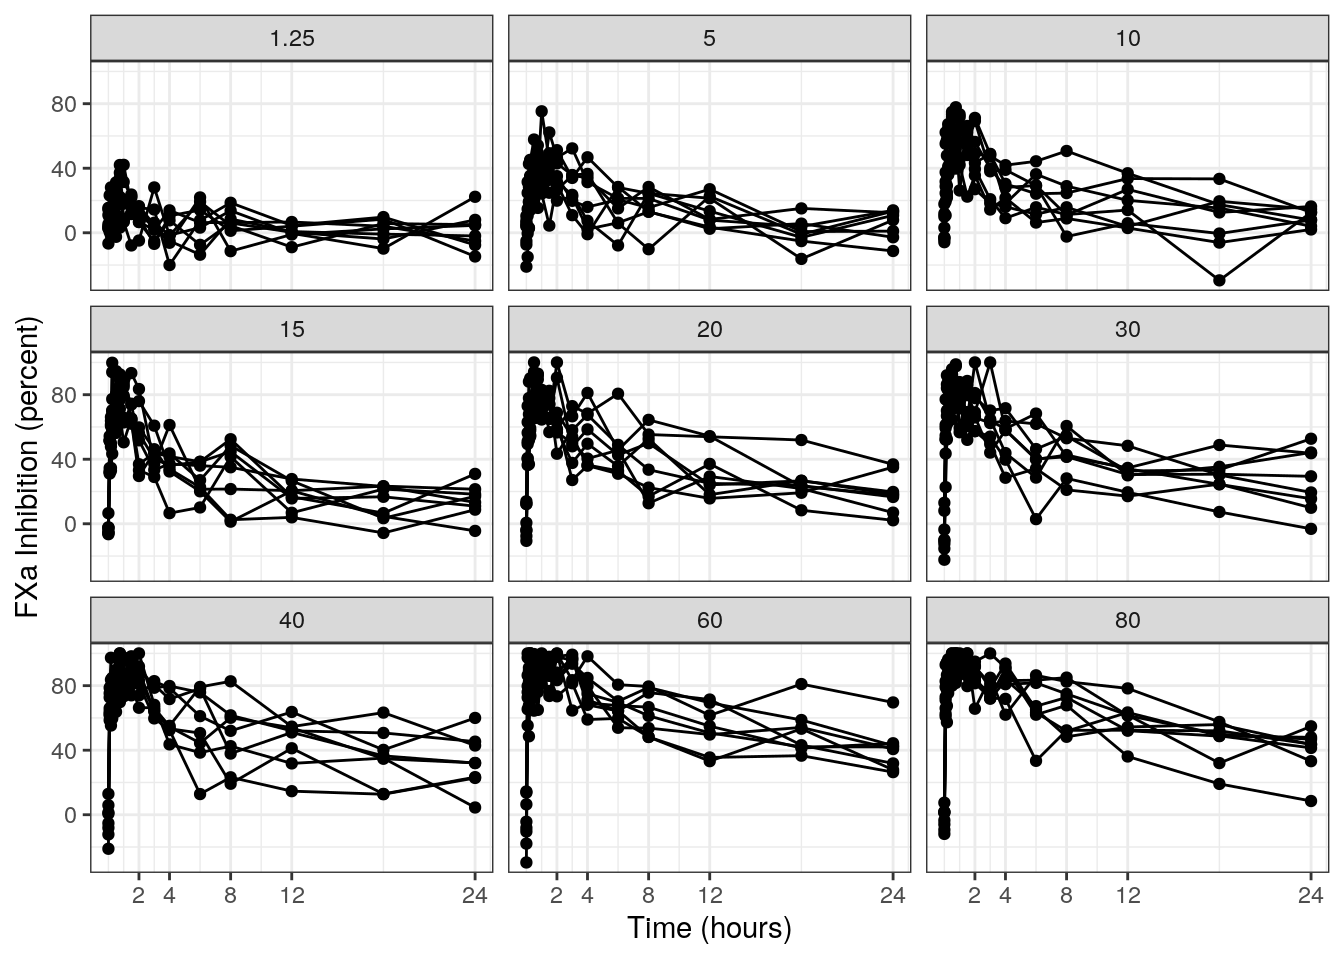
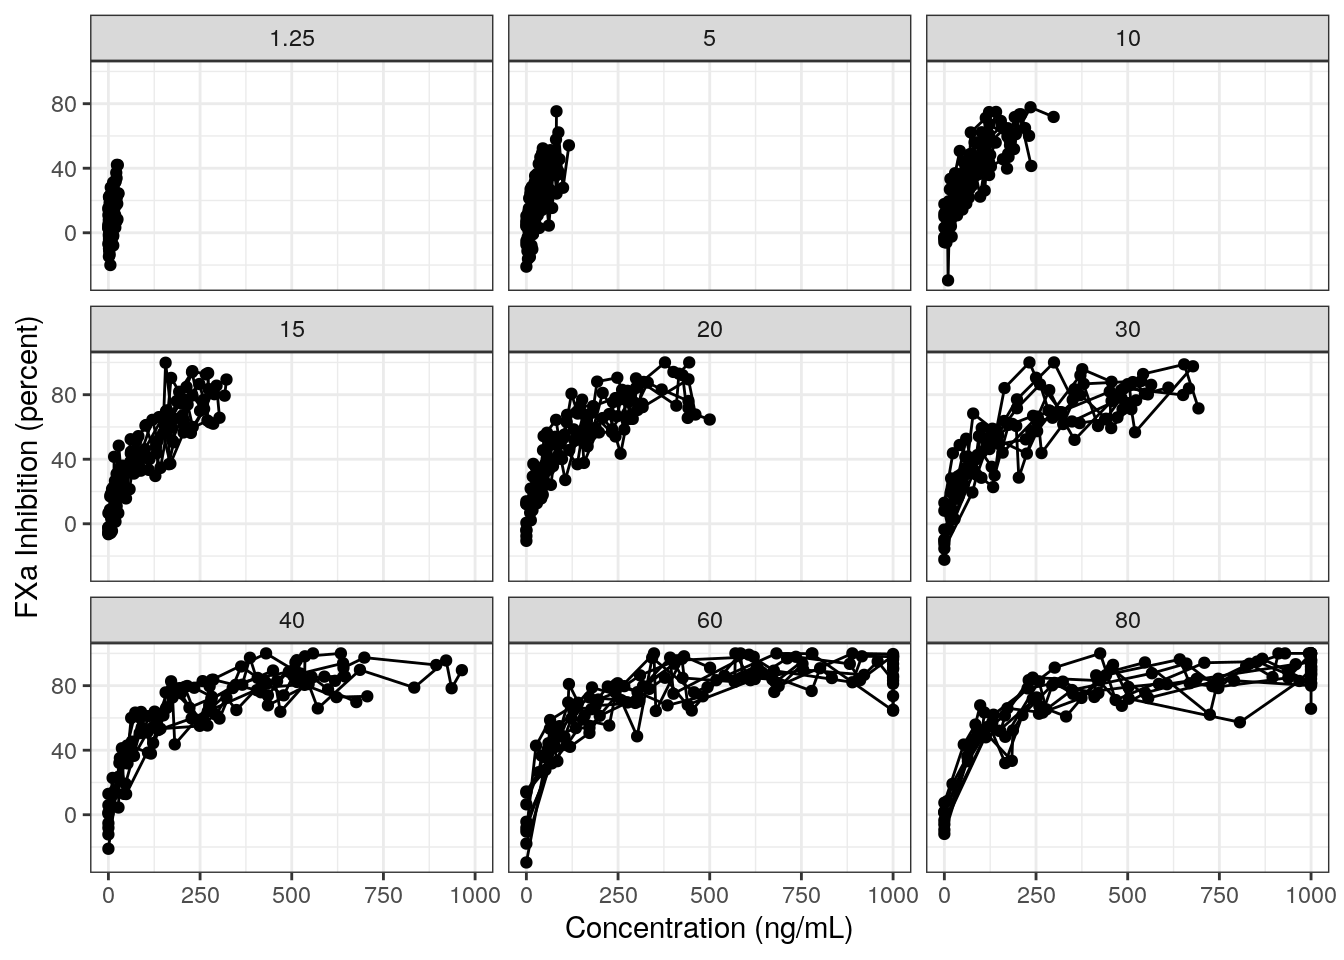
Exploratory analysis shows a concentration profile with a peak around 2 hours and then a slow elimination. The inhibition of FXa demonstrates a similar pattern where the greatest inhibition occurs several hours after the dose and greater inhibition is observed with larger doses. Also, a clear exposure-response relationship with near complete inhibition is observed at concentrations above 500 ng/mL.
data %>%ggplot(aes(x=time, y=cobs, group=ID)) +geom_point() +geom_line() +facet_wrap(~dose) +scale_y_log10(name=ys_get_short_unit(spec)$cobs) +scale_x_continuous(name=ys_get_short_unit(spec)$time, breaks=c(2,4,8,12,24))
Concentration vs. time, stratified by dose group.
data %>%ggplot(aes(x=time, y=fxa.inh, group=ID)) +geom_point() +geom_line() +facet_wrap(~dose) +scale_y_continuous(name=ys_get_short_unit(spec)$fxa.inh) +scale_x_continuous(name=ys_get_short_unit(spec)$time, breaks=c(2,4,8,12,24))
FXa inhibition vs. time, stratified by dose group.
data %>%ggplot(aes(x=cobs, y=fxa.inh, group=ID)) +geom_point() +geom_line() +facet_wrap(~dose) +scale_y_continuous(name=ys_get_short_unit(spec)$fxa.inh) +scale_x_continuous(name=ys_get_short_unit(spec)$cobs)
FXa inhibition vs. concentration, stratified by dose group.
Definitions table
These are the data definitions for the exdata3.csv data set which are used for the exposure-response analysis in this Expo.
VARIABLE
LABEL
TYPE
CODES
ID
Subject ID
numeric
weight
Body weight (unit: kg)
numeric
age
Age (unit: year)
numeric
sex
Sex
numeric
1 = Male, 2 = Female
time
Time (unit: hours)
numeric
dose
Dose (unit: mg)
numeric
cobs
Concentration (unit: ng/mL)
numeric
fxa.inh
FXa Inhibition (unit: percent)
numeric
Definitions object
The data definitions can be loaded into your R session using the yspec package. We use the ys_load() function and point to the yaml file where definitions are coded. These data definitions will be used for axis labels, table headers, and captions in the subsequent analysis scripts.
.      name info    unit          short source
. 1      ID  ---       .     Subject ID      .
. 2  weight  ---      kg    Body weight      .
. 3     age  ---    year            Age      .
. 4     sex  -d-       .            Sex      .
. 5    time  ---   hours           Time      .
. 6    dose  ---      mg           Dose      .
. 7    cobs  ---   ng/mL  Concentration      .
. 8 fxa.inh  --- percent FXa Inhibition      .
Define pdf document
We can render a more formal data definitions document in .pdf format to support a more formal submission package. For more information, see the help files for the package yspec.